Our sample application, which we have just compiled and linked, is now built and ready to run. In this section, we'll concentrate on downloading and debugging this application, and on using the features of CrossStudio to see how it performs.
Getting set up
Before running your application, you need to select the target to run it on. Choose Target > Targets to list in the Targets window each target interface that is defined. You will use these to connect CrossStudio to a target. For this tutorial, you'll be debugging on the simulator, not hardware, to simplify matters.
To connect to the simulator:
- Choose Target > Connect > MAXQ Core Simulator.
—or—
- Choose View > Targets to activate the Targets window.
- In the Targets window, double-click MAXQ Core Simulator.
After connecting, the MAXQ Core Simulator target is shown in the status bar:
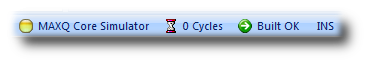
The color of the target-status LED in the status bar changes according to what CrossStudio and the target are doing:
- White — No target is connected.
- Yellow — Target is connected.
- Solid green — Target is free running, not under control of CrossStudio or the debugger.
- Flashing green — Target is running under control of the debugger.
- Solid red — Target is stopped at a breakpoint or because execution is paused.
- Flashing red — CrossStudio is programming the application into the target.
Double-clicking the Target Status will show the Targets window, if it is not already visible.
The core simulator target can accurately count the cycles spent executing your application, so the status bar shows a cycle counter. If you connect a target that cannot provide performance information, the cycle counter panel is hidden. Double-clicking the Cycle Counter panel will reset the cycle counter to zero.
Setting a breakpoint
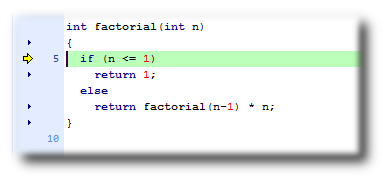
CrossStudio will run a program until it hits a breakpoint. We'll place a breakpoint on the call to debug_printf in main.c. To set the breakpoint, move the cursor to the line containing debug_printf and Choose Debug > Toggle Breakpoint or press F9.
Alternately, you can set a breakpoint without changing the cursor's position by clicking in the gutter of the line to set the breakpoint on.
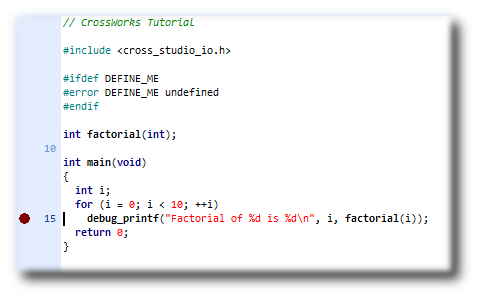
The gutter displays an icon on lines where breakpoints are set. The Breakpoints window updates to show where each breakpoint is set and whether it's set, disabled, or invalid—you can find more detailed information in the Breakpoints window section. The breakpoints you set are stored in a session file associated with the project, so your breakpoints are remembered if you exit and re-run CrossStudio.
Starting the application
To start the application, Choose Debug > Start or press F5.
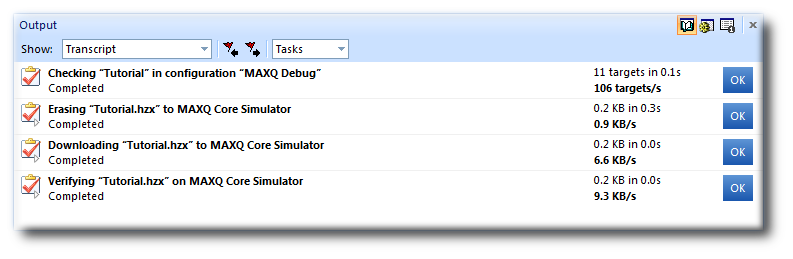
The workspace will change from the standard Editing workspace to the Debugging workspace. You can choose which windows to display in each of these workspaces and manage them independently. CrossStudio loads the active project into the target and places the breakpoints you have set. During loading, the Target Log in the Output Window shows its progress and any problems:
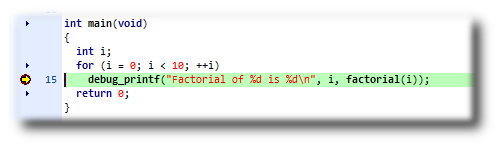
The program stops at our breakpoint and a yellow arrow in the gutter indicates where the program is paused.
Step into the factorial function by selecting Debug > Step Into, by typing F11, or by clicking the Step Into button on the Debug tool bar.
Now step to the first statement in the function by selecting Debug > Step Over, by typing F10, or by clicking the Step Over button on the Debug tool bar.
You can step out of a function by choosing Debug > Step Out, by typing Shift+F11, or by clicking the Step Out button on the Debug tool bar. You can also step to a specific statement by choosing Debug > Run To Cursor. To allow your application to run to the next breakpoint, choose Debug > Go.
Note that, when single-stepping, you may step into a function whose source code the debugger cannot locate. In such cases, the debugger will display the instructions of the application; you can step out to get back to source code or continue to debug at the instruction-code level. There may be cases in which the debugger cannot display the instructions; in such cases, you will be informed of this with a dialog and you should step out.
Inspecting data
Being able to control execution isn't very helpful if you can't look at the values of variables, registers, and peripherals. Hovering the mouse cursor over a variable will show its value as a data tip:
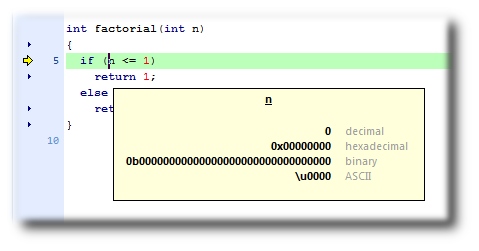
You can configure CrossStudio to display data tips in a variety of formats at the same time using the Environment Options dialog. You can also use the Autos, Locals, Globals, Watch, and Memory windows to view variables and memory. These windows are described in CrossStudio User Guide.
The Call Stack window shows the function calls that have been made but have not yet finished executing, that is the list of active functions.
To display the call stack:
item Choose Debug > Call Stack or press Ctrl+Alt+S.
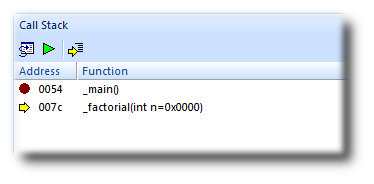
You can learn more about this in the Call Stack window section.
Program output
The Tutorial application uses the function debug_printf to output a string to the Debug Terminal in the Output window. The Debug Terminal appears automatically whenever something is written to it—press F5 to continue program execution and you will notice that the Debug Terminal appears. In fact, the program runs forever, writing the same messages over and over again. To pause the program, select Debug > Break or type Ctrl+. (control-period).
In the next section, we'll cover low-level debugging at the machine level.