This section describes how to debug your application at the register and instruction level. Debugging at a high level is fine, but sometimes you need to look more closely into the way your program executes to track down the causes of difficult-to-find bugs. CrossStudio provides the tools you need to do so.
Setting up again
Next, we'll run the sample application again and look at how it executes at the machine level. If you haven't done so already, stop the program executing by typing Shift+F5, by selecting Debug > Stop, or by clicking the Stop Debugging button on the Debug tool bar. Now, run the program until it stops at the first breakpoint again.
You can see the current processor state in the Register windows. To show the first Registers window:
- Choose Debug > Other Windows > Registers > Registers 1 or press Ctrl+T, R, 1.
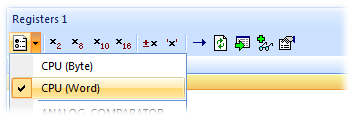
The Registers window can be used to view CPU and peripheral registers. First we shall look at just the CPU registers. To do this, use the Registers 1 window's Register Groups menu to select CPU (Word).
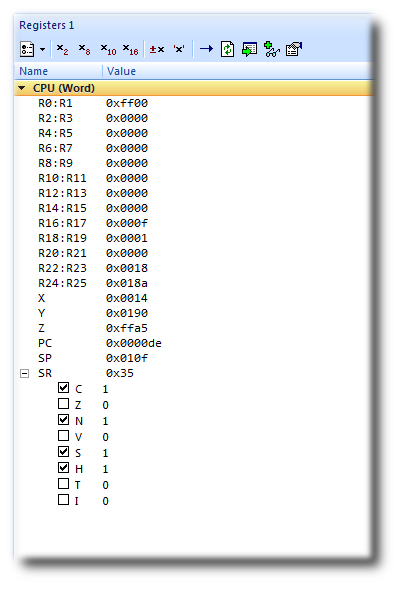
Your registers window will look something like this:
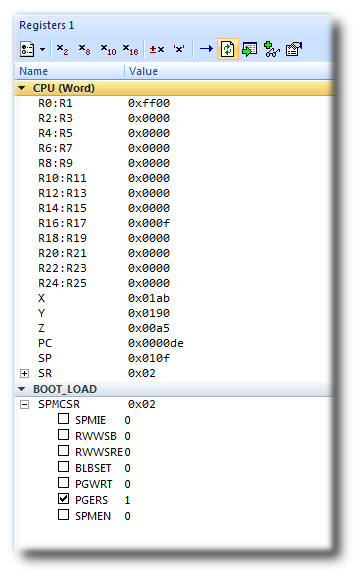
You can also use the registers window to display peripheral registers. To display the state of the target's bootloader registers, select BOOT_LOAD from the Register Groups menu.
There are four register windows, so you can open and display four sets of CPU and peripheral registers at the same time. You can configure which registers and peripherals to display in the Registers windows individually. As you single-step the program, the contents of the Registers window updates and any change in a register value is highlighted in red.
Disassembly
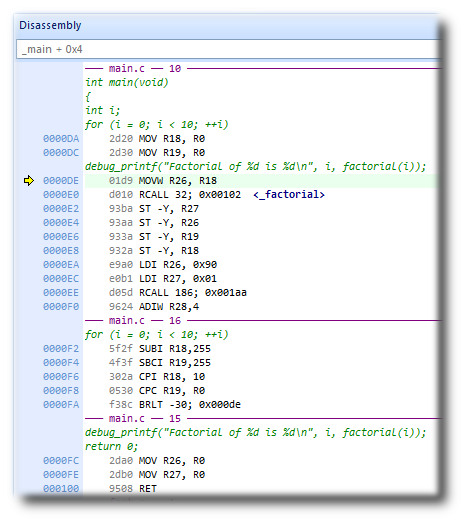
The Disassembly window can be used to debug your program at the instruction level. It displays a disassembly of the instructions around the currently located instruction, interleaved with the source code of the program, if the source is available. When the Disassembly window has focus, all single-stepping is done one instruction at a time. This window also allows you to set breakpoints by clicking in the gutter of lines containing instructions on which you want to set a breakpoint.
Stopping and starting debugging
- You can stop debugging using Debug > Stop or Shift+F5.
- To restart debugging without reloading the program, you can use Debug > Debug From Reset. Note that, when you debug from reset, no loading takes place; it is expected that your program resets any data values as necessary as part of its startup.
- You can attach the debugger to a running target, other than a simulator, using Target > Attach Debugger.